Gantt Chart in Google Sheets is used for Scheduling and planning of projects. In addition to It was designed by an American Mechanical Engineer named Henry Gantt. And it helps us to estimate how long a project should take and how many resources are needed and to plan according to the order in which you can complete tasks.

In other words, it is a graphical representation of a project schedule. Gantt chart Google Sheet helps for managing the relationship between the task. It is the type of Barchart that represents the start and finish dates of various elements of a project that includes tasks, resources.
Covered Topics
Overview of Gantt chart:
This Gantt Chart Google Sheets is complicated at first, but when you learn the basics, you can create a Gantt chart easily and create your projects and explain them to others in an easy way.

Elements of Gantt chart:
- Tasklist: It runs vertically down to the left of the chart to describe the project work and organizes it into groups and subgroups.
- Timeline: It Runs horizontally across the top of the chart and it shows days, weeks, months, years.
- Data line: A vertical line that highlights the current data on the chart.
- Bars: The Horizontal markers on the Right Side of the chart that represents tasks and shows the Start and End dates, progress, and time duration
- Milestones: This calls out our major dates, decisions, events, and deliverables. And these are like Yellow diamonds.
- Dependencies: They are light gray lines that connect tasks that need to work in a certain order.
- Progress: This shows how far along work and it is indicated by percent complete bar shading.
- Resource Assigned. It indicates the team’s responsibility to complete a task.
History of Gantt Chart:
Karol Adamiecki invented the first project management chart in the year1896. But the name of the chart is called Gantt chart but why it is not an Adamiecki chart?
Here Is the history
- In 1896 Karol first invented the project chart named the Harmonogram but with limited exposure.
- Now today Gantt charts are the most preferred tools for managing projects in all types and sizes. In 1910-1915 Henry Gantt publishes his own Project Management system.

Who uses the Gantt Charts Mostly?
These Gantt charts are mostly used in all type of Industry, It is used to schedule, plan and execute their projects. The Industries are
- Design and Creative.
- Marketing.
- Human Resources.
- Event Planning
- Consulting Agencies.
- Software Development.
- Construction.
- Manufacturing.
Prons and Cons of Gantt Chart:
A Gantt Chart Google Sheets– is used to project actions standing in the front row. In this, we can easily notice the small changes in the project indicating different colors. In this, we can easily Visualize the entire project.
Visualize entire projects:
From this Gantt Chart Google Sheets, we can easily observe what is going on step by step process. In this planning of the project is one thing and how it plays and executes is another thing. we can observe clearly what happens as shown in the below figure.

Task Connection:
Therefore, We can easily shift tasks around without breaking your progress. with dependencies, you can keep tasks connected with everyone. Here Clear communication is Very Important without communication the task may delays, and cost overruns. As a result, It helps you to communicate easily without failures and can easily the project in perfect time.


How to Make The Gantt Chart in Google Sheets?
Process of Making a Gantt Chart Google Sheets:
1: Firstly, Open Google Sheets and Open New Spreadsheet. Create a table with headings to the cells like Task Name, Start Date, and End Date.

Now make a similar tab to the previous one to calculate each graph portion of the Gantt chart. Task Name, Start Day, and Duration or days to complete the task. The representation is shown in the below table.

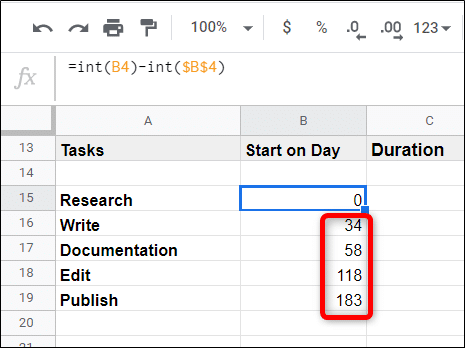
2: After that add headings in place you need to calculate the start date and time duration. To calculate the “Start on Day” you must find the difference between each task’s start date and the start date of the first task. During this time it first converts each data into an integer and then subtracts from the first start date.
( <Taskstart> -<FirstTaskStart> ) It represents as
=INT(B4)-INT($B$4)

3: In the formula, the <FirstTaskstart> is always an absolute value. Google sheets use the ($) Dollar sign character to lock a column or row or in both cases. use the dollar sign like makes sure it always refers to the value in B4, which is the start of the first task, and press enter key.
Click on the cell and then double-click the little blue Square.

The Sheet will use the same formula but make sure to refer to the correct cell above for the cells directly completing the sequence.
4: Calculate the duration of time, calculation is a little bit tricky and finds the difference between a few more variables.
( <current TaskEndDate>-<FirstTasksStartDate>)-( <current TaskStartDate>-<FirstTasksStartDate>)

Convert each date format into an integer as a reference to your formula. After you press the “Enter key” click on the cell again and double click on the little blue square.

Just like the same as above Sheets Fills in the remaining cells for you.

Highlight the whole table.

Click Insert > Chart.
Creating Gann Chart Spreadsheet:

5: From the Chart editor panel on the right side of the windows, click the drop-down box under “chart Type”, and click on “Stacked Bar Chart”.

Finally, click on any of the light red bars, click on the color selector and then choose “None” from the top selectors.

Go to Customize tab in the Chart Editor pane, click on Chart & Axis Titles,” and name your chat.

6: Finally you have created that fully functional Gann chart that updates in real-time.
